All tickers · Updated 2026-10-22 (ET)
$META Technical Levels
Based on the Oct 21, 2026 close. These are the same numbers the TA Levels bot serves on X today.
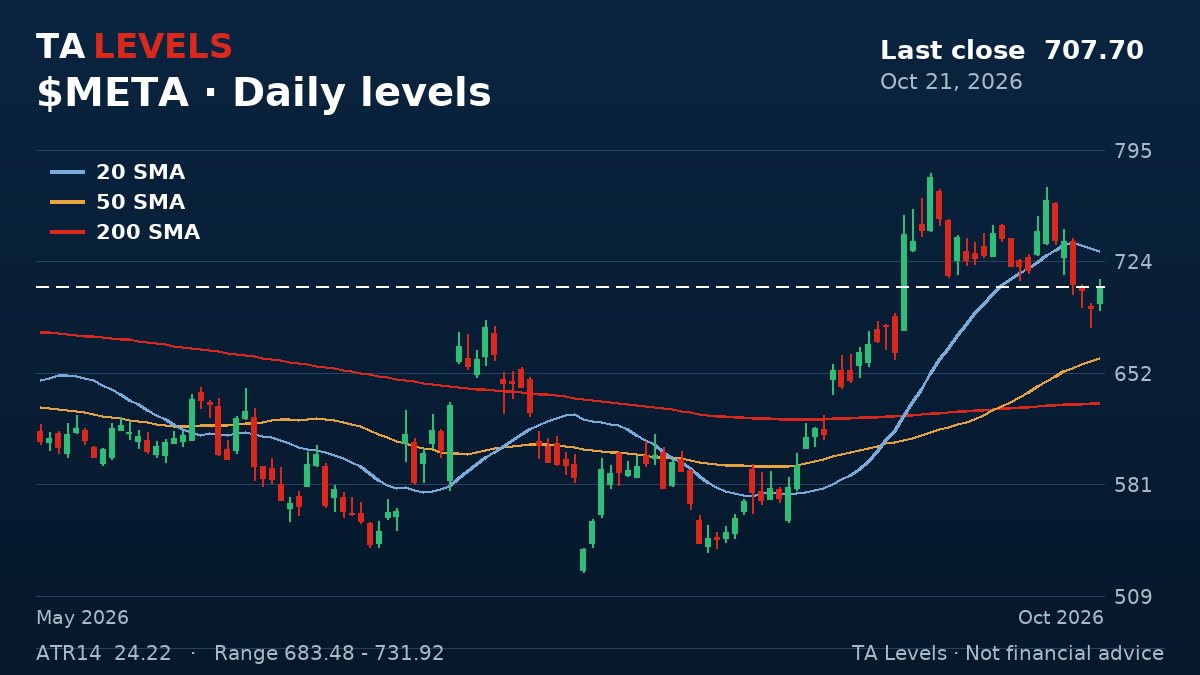
META closed at 707.70 on Oct 21, 2026, above its 200-day average (632.67), so the long-term trend reads up. Near term, price sits above 1 of its 4 short-term averages (9 EMA, 21 EMA, 20 SMA, 50 SMA). ATR(14) is 24.22 (3.4% of price), so a normal daily range runs about 683.48 to 731.92.
Levels
| Indicator | Value |
|---|---|
| Last close | 707.70 |
| 9 EMA | 717.08 |
| 21 EMA | 714.13 |
| 20 SMA | 730.05 |
| 50 SMA | 661.67 |
| 200 SMA | 632.67 |
ATR(14): 24.22 → normal daily range 683.48–731.92
Get $META levels any time on X: tag @talevels $META and the bot replies with these levels and a chart in about a minute. Free, no signup.